Did you know around 30 to 40% of customers spend 10 to 30 minutes researching their purchases? In such a competitive environment, online and offline retailers are under immense pressure to capture and maintain attention.
As online shopping grows, traditional stores face new challenges to stay relevant, while online retailers must continuously innovate. Attention heatmap analysis is transforming how businesses succeed in both spaces.
Heatmaps offer a visual representation of customer behavior by tracking movements and aggregating data. When paired with retail predictive analytics and intelligence, heatmaps help businesses fine-tune store layouts and unlock opportunities to connect with customers on a deeper level. Let's discuss how attention heatmaps help retail companies create a more engaging experience in digital and physical spaces.
What are Attention Heatmaps?
Attention heatmaps visually show where customers focus their attention, using color gradients to highlight different levels of engagement. Red areas, or "hot" zones, indicate where attention is highest, while blue zones reveal where engagement drops off. Businesses can apply these heatmaps to both digital and physical spaces, gaining valuable insights into customer behavior and understanding what captures their audience’s interest—and what doesn’t.
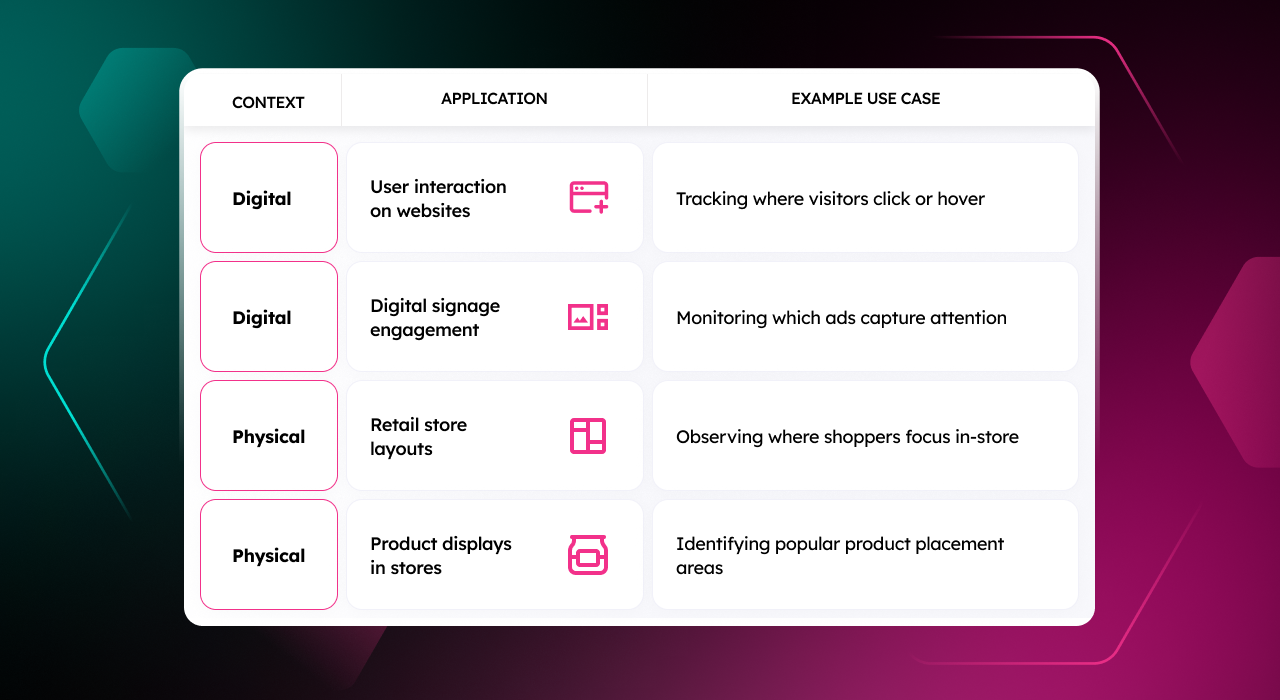
Attention heatmaps have diverse applications in both online and offline spaces. In digital environments, they are commonly used to analyze user interaction with websites, advertisements, or digital signage, highlighting what content draws the most focus.
In physical contexts, they are used to track where customers focus their attention in retail stores, product displays, or other physical spaces, providing insight into consumer behavior and aiding in the optimization of layouts.

The Role of Attention Heatmaps in Digital Retail Spaces
Attention heatmaps give retailers powerful insights into how customers engage with websites, mobile apps, and digital content. These visual tools highlight areas that capture the most attention—whether it’s product images, promotional banners, or key navigation elements. Here’s how attention heatmaps can transform digital retail spaces:
Retail Predictive Analytics in Digital Spaces
Predictive analytics are essential for understanding customer behavior in digital spaces. When paired with attention heatmaps, these tools allow retailers to forecast which products, web pages, or interface elements will draw the most attention and lead to conversions.
Analyzing historical heatmap data helps retailers spot trends and behavior patterns, like the most clicked sections or how users navigate a site. For instance, insights from predictive analytics and heatmaps can help retailers identify popular products and position them in prominent spots, such as homepage banners or pop-ups.
Customer Journey Mapping with Attention Heatmaps
Mapping the customer journey is crucial for enhancing user experience and boosting conversions. Attention heatmaps help retailers visualize how users move through their online stores, showing which elements grab attention and which may cause drop-offs. Identifying these friction points helps retailers create a smoother, more intuitive experience. With a more streamlined customer journey, retailers increase the likelihood of conversions.
Optimizing Product Placement in E-Commerce
Attention heatmaps reveal where users focus their attention on a webpage. This insight helps retailers position high-margin, best-selling, or promotional products in high-visibility areas.
Optimizing product placement based on heatmap data helps retailers ensure their most important items are noticed. It also creates a more intuitive and visually appealing layout, increasing engagement and sales.
The Importance of Attention Heatmaps in Physical Retail Spaces
Attention heatmaps, retail predictive analytics, and intelligence provide physical stores with a powerful toolset. They allow retailers to track customer movements, tailor spaces to specific audiences, boost marketing efforts, and increase engagement and customer satisfaction. Here’s how attention heatmaps can transform physical retail spaces:
Attention heatmaps help retailers identify underutilized spaces and transform them into high-value areas with interactive elements or promotions. This ensures optimal use of every store section while offering insights into which products perform best in specific locations for smarter inventory management.
Retailers can convert low-traffic "dead zones" into visually appealing spots for Instagram photos or product demo stations. Slow-moving stock can be relocated to more prominent areas, giving these products a second chance to attract interest. Finally, creating a natural flow through key areas helps expose shoppers to top sellers and promotional items.
Retail Intelligence for In-Store Design
One of the key benefits of attention heatmaps and predictive analytics is their ability to continuously optimize store layouts. Retailers can experiment with different configurations and use data to identify which setups generate the most customer engagement and sales. A/B testing product placement provides valuable insights into how layout changes affect customer behavior.
Combining real-time heatmap data with predictive analytics helps retailers forecast future foot traffic based on historical patterns, seasonal trends, and promotions. For instance, heatmaps might show high traffic around tech gadget displays, while a smart coffee table with built-in tech features receives little attention.
Predictive analytics show that the store can anticipate a surge in demand for tech products during the holiday season. Both these insights can inspire the store to place the smart coffee table with tech gadget displays to boost smart table sales during peak holiday season.
Space Management and Customer Attention
Attention heatmaps visually map how customers move through a store, revealing "hot" zones where they linger and "cold" zones they overlook. This insight allows retailers to strategically place high-margin items or promotions in areas of high traffic. Positioning popular products where customers naturally spend the most time helps retailers increase the chances of impulse buys.
For example, a retailer can place a healthy snack display nearby if heatmaps show heavy foot traffic near the fresh produce section. This strategic placement boosts visibility and attracts health-conscious shoppers. As a result, the product enjoys greater attention and more sales.
The Benefits of Using Attention Heatmaps for Retail Optimization
Attention heatmaps are valuable tools that give retailers insights into where customers focus their attention. This allows businesses to adjust layouts and designs to create a smoother shopping experience, increase engagement, and drive sales. Here are a few key benefits of using attention heatmaps for retail optimization:
Improving the Customer Experience
Attention heatmaps enhance customer experiences by offering data-driven insights into how people navigate and engage with physical or digital spaces. Mapping customer movements helps businesses optimize layouts, reduce friction, and create more intuitive, personalized experiences.
- Improving Customer Flow: Heatmaps track customer flow, highlighting high-traffic and overlooked areas. For example, if customers congregate near the front but avoid certain aisles, the store can rearrange the layout by placing popular items or promotions in less-visited areas. This balances traffic, reduces congestion, and encourages discovery of new products.
- Enhancing Website UX: In digital spaces, heatmaps show where users click or linger. If users spend time on product pages but don't move to checkout, businesses can reposition checkout buttons or add recommendations in visible areas. These adjustments streamline the user experience and encourage completed purchases.
Smarter Decisions with Data Analytics for Retail
Heatmaps provide businesses with actionable insights based on customer behavior, enabling smarter, data-driven decisions for both physical and digital experiences.
- Data-Driven Product Placement: Heatmaps track customer interactions during peak times, offering valuable data on high-traffic areas. For example, a grocery store can use heatmaps and sales data to place frequently bought-together items closer, encouraging impulse purchases and boosting sales.
- Improving Website Performance: Heatmaps are invaluable for A/B testing in e-commerce. Retailers can test different webpage layouts and analyze customer interactions to determine which design leads to better engagement and higher conversions.
Increasing Engagement and Sales
One of the most significant benefits of attention heatmaps is their ability to boost engagement and sales. Retailers can maximize customer interaction and discover upselling opportunities by placing high-margin or promotional products in the most engaging areas, both in-store and online.
- Optimizing Cross-Selling: Heatmaps provide insight into where customers spend the most time. Retailers can pair a product with related, higher-selling items if it isn't receiving enough attention. For instance, placing high-margin accessories like belts near a popular denim section encourages customers to consider complete outfits, increasing the chances of selling underperforming products.
- Maximizing Digital Engagement: Heatmaps reveal which parts of a webpage attract the most attention and which are ignored. If users focus on product images but miss the "Add to Cart" button, redesigning the layout to position calls-to-action near these engaging elements can improve visibility and boost conversions.
Best Practices for Using Attention Heatmaps in Retail
Attention heatmaps offer retailers valuable insights into customer behavior, but their true potential is unlocked when used strategically. Here are a few best practices for using attention heatmaps to optimize both in-store and online experiences.
- Integrating Heatmaps with Retail Analytics
To maximize the use of attention heatmaps, retailers should combine them with other retail analytics.
- Correlating Sales Performance: Linking heatmap data with sales figures can help retailers see how customer attention translates to actual purchases. For example, a store might have high foot traffic but low conversion rates in certain areas, signaling a need to rethink product appeal or pricing.
- Understanding Customer Demographics: Layering demographic data on top of heatmap insights helps retailers segment their audience. Younger shoppers might be drawn to trend-driven displays, while older customers may prefer easy-to-navigate sections.
- Regular Testing and Optimization
Attention heatmaps should be used as part of an ongoing process of testing, monitoring, and optimizing both physical and digital spaces. Retailers can use them to track how changes in layout or design affect customer engagement over time, especially as preferences evolve.
- A/B Testing: Retailers can run A/B tests with heatmaps to compare product placements or store layouts. This might involve testing two promotional setups in a high-traffic area in a physical store. Online, it could mean adjusting page layouts or call-to-action (CTA) buttons to see which drives more engagement.
- Seasonal Adjustments: Customer attention often shifts with seasonal promotions. Regularly reviewing heatmap data allows retailers to fine-tune strategies throughout the year to align with changing trends and demands.
- Cross-Channel Heatmap Usage
Attention heatmaps should be applied across both digital and physical spaces to create a seamless omnichannel experience.
- Unified Customer Journey: Combining heatmap data from both online and in-store interactions helps retailers create a seamless customer experience. For example, if online heatmaps show a product category receives excessive attention, retailers should ensure those same products are prominently featured in-store.
- Consistent Product Placement: Ensuring consistent product and content placement across channels is essential for a smooth shopping experience. If a product gains significant attention online, it should be equally prominent in-store to reinforce customer interest.
Case Study: A Success Story from a North American Specialty Retailer
According to McKinsey, a North American specialty retailer specializing in nonfood products used a heatmap to assess how well it used big data. The heatmap clearly summarized the company’s strengths and highlighted areas needing improvement. With this insight, the retailer was able to sharpen its focus on key areas for development. This tool helped prioritize future investments and streamline operations to better meet customer needs.
Key Outcomes
- Identified key areas for improvement, including data quality, management, and technology infrastructure.
- Initiated programs to improve data quality and management processes.
- Introduced a new pricing model based on data-driven insights.
- Streamlined operations, enabling more effective decision-making.
- Aligned more closely with customer needs through data-based strategies.
Conclusion
As retail continues evolving into a data-driven industry, attention heatmaps have become essential for optimizing physical and digital environments. From improving the customer experience to guiding product placement and enhancing marketing strategies, heatmaps offer retailers real-time insights that drive smarter decisions.
Integrating heatmaps with predictive analytics and retail intelligence, stores, and websites stay aligned with customer needs. Dragonfly AI takes this optimization to the next level with its cutting-edge platform that delivers on-demand creative testing and analytics.
Dragonfly AI provides the tools needed to enhance your customer journey across all channels while giving you real-time insights into how each strategy is performing. Ready to take your retail optimization to the next level? Book a demo today!
Read more:
The Ultimate Heatmap Guide: Make Smarter Design Decisions
Top 5 Benefits of Heatmaps
A Guide to Mobile App Heatmaps
Using AI-Powered Heatmaps to Optimize Website Design


