Unique in-store brand experiences are now part and parcel of the experience for consumer companies hoping to rise above the fray in a saturated marketplace. Data visualization and AI are central to this and help uncover hidden shopper insights, enabling retailers to craft targeted promotions on an individual basis rather than taking a one-size-fits-all approach.
With that in mind, we look at how elements like visualizing inventory, purchasing tendencies, store traffic, and demographic data pave the way for real-time tracking of operations and customer engagement. How can retailers harness these visualized insights to create bespoke physical shopping destinations aligning with exactly what nearby customers desire?
The Role of Data in Understanding In-Store Consumer Behavior
Data helps retailers decode the drivers of customer experiences within physical stores. Advanced sensors and analytics translate behavioral signals from shoppers' footsteps to facial expressions into digestible business insights.
Tracking consumer journeys opens an unparalleled window into preference tendencies, emotional responses, purchasing motivations, and beyond.
Retailers can glean rich data through sources spanning security cameras, Wi-Fi networks, Bluetooth beacons, and more. Especially important are the emerging AI capabilities that can detect subtle patterns and micro-signals about shoppers by processing observational inputs and contextual signals.
These data streams produce revelations around:
- Peak store traffic flows
- Popular product display placements
- Ideal promotion timing
- Individualized shopper segment profiles
- Real-time intervention triggers.
The in-store environment presents a hotbed of behavioral data signals instrumental for everything from optimizing sales conversion and customer satisfaction to space utilization and operational processes.
As analytics interpretation matures, data leads retailers to not just monitor what happens within stores but also predict and prescribe what should happen next based on each customer's multidimensional profile.
What is Data Visualization?
Data visualization transforms raw data into intuitive graphical depictions that uncover trends, variations, and patterns. This differs from traditional data analysis in distilling complex information down to the most essential and actionable insights.
For the retail sector, data visualization represents a radically easier way to track key performance indicators (KPIs) encompassing sales, inventory, web traffic, customer engagement, and more.
Unlike tabular reports or spreadsheets crammed with numbers, visualized data uses compelling charts, graphs, and graphics to showcase essential trends. Heatmaps indicating regional purchase differences, animated charts highlighting seasonal inventory needs, and interactive online dashboards with store metrics are just some examples.
The cognitive ease of deciphering these visuals allows employees throughout retail organizations, not just data scientists, to assess performance. The ultimate difference boils down to data visualization's speed, clarity, and democracy in placing impactful insights around operations, marketing, and finance into diverse hands through communicative graphical interfaces.
The Power of Visual Data in Retail
Visual data refers to graphically depicted information presented through charts, gauges, maps, or other vibrant formats. For retailers overloaded with transaction reports, customer lists, inventory tables, and web analytics, visual data offers increased clarity.
By transforming key findings into colorful visuals aligned with users' cognitive capabilities, patterns suddenly leap off the page. Visualized customer segmentation may undercover a primed-for-loyalty community, while heatmaps can expose overstocked locations. Even store associate tasks can appear less daunting when vibrantly rendered as punchy infographics.
The advantages over raw data or walls of numbers are undeniable—faster insights, wider accessibility, stickier takeaways, and enhanced decision-making all form part of the analysis of the results.
Our brains process visuals 60,000 times quicker than text, freeing bandwidth for strategy rather than calculations. By duty, executives analyze business metrics, but visualizations keep problems visible.
Types of Data Visualization Tools for Retail Monitoring
A trove of data visualization software now enables retailers to gain an eagle-eye perspective on in-store operations. These tools empower faster assessment and corrective actions by translating site-level monitoring into intuitive visual depictions. Let's explore popular retail-optimized options.
Interactive Floor Maps
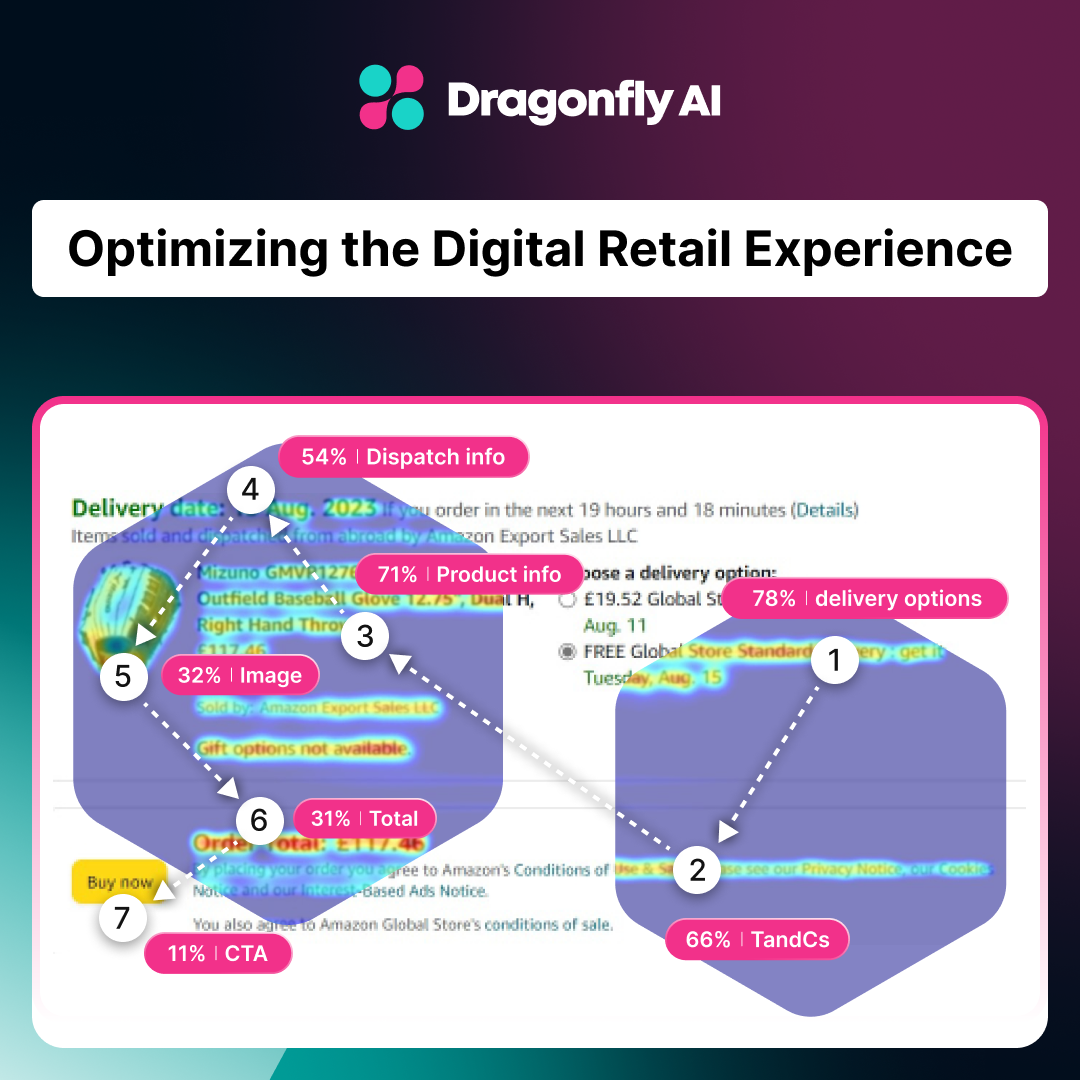
These digitized layouts showcase real-time shopper movement patterns through heatmaps overlaid on store diagrams. At a glance, retailers see high-traffic spots to prioritize or low-engagement zones signaling changes. By time-slicing and adding layers like displays and signage, floor maps provide an adaptable visual interface for monitoring operational analytics.
Point-of-Sale Dashboards
Customizable sales dashboards allow corporate and store-level teams to visualize weekly transactions, inventory needs, top-selling items, and promotions performance through charts immediately updated from POS data streams. Managers can filter views by date ranges, product categories, and location while tapping visual cues to optimize future orders.
Successful Data Visualization in Retail
What does it look like when a brand successfully implements a data visualization strategy in the retail sector? These brands have taken their output to another level using data visualization.
- Starbucks achieved remarkable success by harnessing customer intelligence for tailored rewards and product suggestions. Analyzing myriad transactions pursuant to purchases has seen this coffee giant's revenue rocket through heightened.
-1.png?width=1280&height=700&name=Blog%20image%201%20(4)-1.png)
- The Weather Channel, Pantene, and Walgreens partnered on an insightful campaign revealing hair care purchase patterns influenced by humidity's shield. By acting on data-backed weather forecasting, the triad targeted humid climes to lift Pantene sales at Walgreens stores a full 10 percent over campaign months.
- Amazon analyzes browsing histories, purchase tendencies, and search patterns and sees this e-commerce titan serve up hyper-targeted product recommendations that enhance customer satisfaction.
- Walmart’s supply chain management heightens efficiency through analytical forecasting of demand trends down to SKU specificity. Inventory and stock levels shine as well-balanced across stores with scarce overstocks and rare stockouts, thus ensuring customer satisfaction based on the data's direction.
- P&G’s own supply chain optimization relies on analyzing sales data, market signals, and social media listening to align production and distribution to dynamic consumer demand. At a formidable scale, data fuels this CPG giant to pump out brands shoppers continue grabbing by the billions.
- Within its hallmark department stores, Macy's visually tracks shoppers' movements and interactions using advanced camera kits and sensors. This constant flow then optimizes layout mapping and product placements using cold hard data from warm-bodied humans.
These leading retailers achieved transformative business impacts through data visualization across three key dimensions—customer intelligence, risk monitoring, and supply chain optimization.
Personalization, forecasts, and efficiency reached new heights as a result. Effectively harnessing analytics visualizations enabled everything from boosted loyalty to inventory integrity to sales uplift by revealing valuable demand trends and behavioral drives hiding within complex data streams.
Integrating AI with Data Visualization for Predictive Insights
Unifying AI algorithms with data visualizations means retailers can break free of hindsight-based reporting limitations and actively unveil predictive insights around customer behaviors, inventory needs, and operational scenarios.
.png?width=1280&height=700&name=Blog%20image%202%20(3).png)
Interactive visual models backed by robust machine learning unlock a range of in-store decision optimization capabilities that translate future-gazing analytics into tangible guidance. One area of advantage is personalized promotions.
Here, AI-powered visualizations can map specific customer segments and dial in the top predictors of engagement. This intelligence allows for real-time optimization of targeted offers based on minute-to-minute store traffic flows.
For example, a retailer could send personalized mobile discounts when a regular customer is identified as likely to make an immediate purchase based on their prior behavioral patterns.
Another predictive capability is significantly more accurate inventory and supply chain forecasting. Sophisticated visual models can ingest both internal transaction data and external signals around holidays, weather, or local events to better anticipate demand swings.
This prevents overstock situations, lost sales, or waste. Through interactive charts, store managers can fine-tune automated order volumes that balance the latest sales trends against promotion schedules.
Even intelligent store design becomes more achievable by combining AI with visualization tools. Digital twin simulations let retailers make changes in a what-if environment powered by years of accumulated foot traffic data, video feeds, and sensors.
Here, the future emerges clearly—from ideal new store layouts to the optimal product mix to placing customer experience staff where they will have a maximal impact when opening doors.
The power ultimately lies in processing huge datasets through AI to unlock insights no human could, but then rendering it visually for easy absorption and action. That future is now for retailers who are savvy enough to envision it.
Practical Tips for Implementing Data Visualization in Stores
Data visualization offers remarkable potential to enhance in-store experiences and decision-making. But where should retailers start when bringing visual analytics capabilities onsite? Follow these tips for high-impact adoption across store formats:
Begin with Business Goals
Clarify the key questions before getting overwhelmed by fanciful representations. Apparel retailers, for instance, may examine style trends or inventory needs. Grocers might analyze basket metrics and labor metrics per aisle. Defining the business objectives, KPIs, and decisions to improve guides effective visualizations.
-1.png?width=1280&height=700&name=Blog%20image%203%20(3)-1.png)
Start Small, Think Big
A complete analytics overhaul will likely exceed budgets. Instead, prioritize one to two of the most problematic areas, like long checkout lines or low repeat purchases. Apply data visualization here first with a long-term, enterprise-wide lens on possibilities. Move stepwise toward that bigger vision.
Involve Store Teams
Corporate teams driving all decisions are failing at a greater rate. Visualizations should empower location teams with self-service insights around merchandising, staffing, and more tailored to their customers. Let store associates slice the data, uncover their growth opportunities, and correct course immediately.
Integrate New and Existing Data
Modern analytics require customer traffic heatmaps, sensors, and video feeds. But don't abandon legacy data like transactions and inventory systems. Blend these sources for the fullest perspective on customer behavior and operational dynamics. Interactive visualization layers bridge new and old.
The possibilities of data visualization are endless. But retailers maximizing their value ground all decisions into concrete business goals, move systematically from pain points outward, distribute self-service access across the company's footprint, and help every store visualize a better future from both new and old sources.
Summary: Enhancing the In-Store Experience with Data Visualization
Data visualization unlocks transformative opportunities for retailers to enhance in-store shopping through deeper customer and operational intelligence. As analytics capabilities grow more predictive thanks to AI, the future points clearly toward stores that embed data visualizations for associates and shoppers alike to take informed actions at each moment based on what will happen next.
Predicting attention on in-store creative is one of the many ways customer experiences can be improved. From packaging to end-of-aisle displays to floor stickers, predict whether the right attention will be on your brand. Click here to see how Dragonfly AI can help.


-1.png?width=1280&height=700&name=Blog%20image%201%20(4)-1.png)
.png?width=1280&height=700&name=Blog%20image%202%20(3).png)
-1.png?width=1280&height=700&name=Blog%20image%203%20(3)-1.png)
