.png?width=596&height=562&name=2x%20(1).png)
In the world of advertising, eCommerce, and retail, common challenges like low conversion rates, cart abandonment, product placement dilemmas, in-store layout optimization, and user experience friction persist.
Attention heat maps allow you to map out how users interact with a website or app. They show you where users will likely see at first. And the beauty of heatmaps is that they're not just pretty visuals – they actually provide you with data-driven insights.
These tools help you spot design weaknesses, and fine-tune your messaging alignment which in turn addresses communication and visibility challenges. This enables businesses to convert their data-driven insights to dollars.
Understanding Heatmap Analytics
Heatmaps visually represent data, emphasizing variations with color. The data is overlaid onto an image or webpage and by using varying color intensities, show you where user activity is highest. A darker color (usually red) indicates the user's heightened area of interest. Decision-makers can use these insights to understand user behavior.
Heatmaps fall into two main categories: Interaction Heat Maps and Attention Heat Maps.
Interaction Heat Maps
These measure active engagement on websites or mobile apps:
-
Click Maps: Visualize user clicks, highlighting which web page elements are interacted with.
-
Mouse Move Maps: Track mouse movement to understand user attention on a webpage.
-
Scroll Maps: Visualize how users scroll through web pages, indicating content visibility.
For interactive content like websites and applications, these heatmaps are suited.
Attention Heat Maps
These work for non-interactive content like packaging, advertising, and videos
- Eye Tracking Heat Maps: Use real data to show how audiences view content, recording eye movements and fixation durations.
- Predictive Attention Heat Maps: Utilize AI to predict audience attention, presenting data as a heatmap.
For both interactive and non-interactive content, these heatmaps are suitable.
.png?width=1920&height=1920&name=BlogImage_1%20(1).png)
The ROI Challenge in Digital Marketing
Consumer packaged goods (CPGs) are everyday products like food, beverages, cosmetics, and cleaning supplies. The CPG industry has embraced digital marketing to reach its audience in the digital era, but it grapples with challenges in measuring the ROI of these efforts.
Some key challenges include:
- Multi-Channel Marketing: Numerous digital marketing channels like social media, email marketing, pay-per-click advertising, and SEO create complexity in tracking ROI due to differing metrics and measurement methods.
- Complex Customer Journey: The digital customer journey involves multiple touchpoints, including social media, email, and website visits, making it hard to attribute revenue accurately to each interaction.
- Lack of Standardization: The digital marketing industry lacks a universal ROI definition, with different channels employing varying metrics, complicating ROI comparisons.
- Time Frame for Measurement: Digital marketing campaigns often require time to yield results, and the full impact may not be evident until months or even years after the campaign, making short-term evaluation challenging.
Despite the challenges, in driving business growth, data analytics plays a pivotal role. As such, data-driven decision-making empowers CPGs to optimize strategies and outperform competitors in the digital age.
The multi-channel information has several benefits, including:
- Integrated Data Analytics: Consolidating data from various sources, like website analytics, customer databases, and social media, provides a bird's view of all the gaps leading to revenue leaking.
- Multi-Touch Attribution: Customer journeys are hard to track. Attribution models clear the vision by highlighting critical touch points that enhance resource allocation and market strategies.
- Customized KPIs: Tailored KPIs align with unique goals and industry dynamics, ensuring precise measurement and adaptable strategies.
- Long-Term Tracking: Monitoring metrics over extended periods identifies trends and evolving preferences, informing resilient, data-driven decisions that foster sustainable growth.
How Heatmap Insights Drive ROI
Attention maps offer actionable insights by predicting where consumer attention will be. They help businesses optimize content, design, readability, and user experience for more engaging and effective digital solutions.
The following are key strategies facilitated by attention maps to improve ROI:
- Heatmaps highlight "hotspots" or high-attention areas, aiding in content prioritization. In eCommerce, it prioritizes promotions and product placements on high-attention sections of the homepage. In the world of advertising, exposure of the product to the consumer is key. Heatmaps solves one aspect of it by adjusting ad placement.
- They inform businesses about placing important content, call-to-action buttons, images, and headlines to maximize user engagement and conversions. They also indicate distractors for effective optimization.
- Attention heatmaps provide a baseline for A/B testing. Changes to content or design can be assessed by comparing how they impact user attention, ensuring that adjustments align with user preferences.
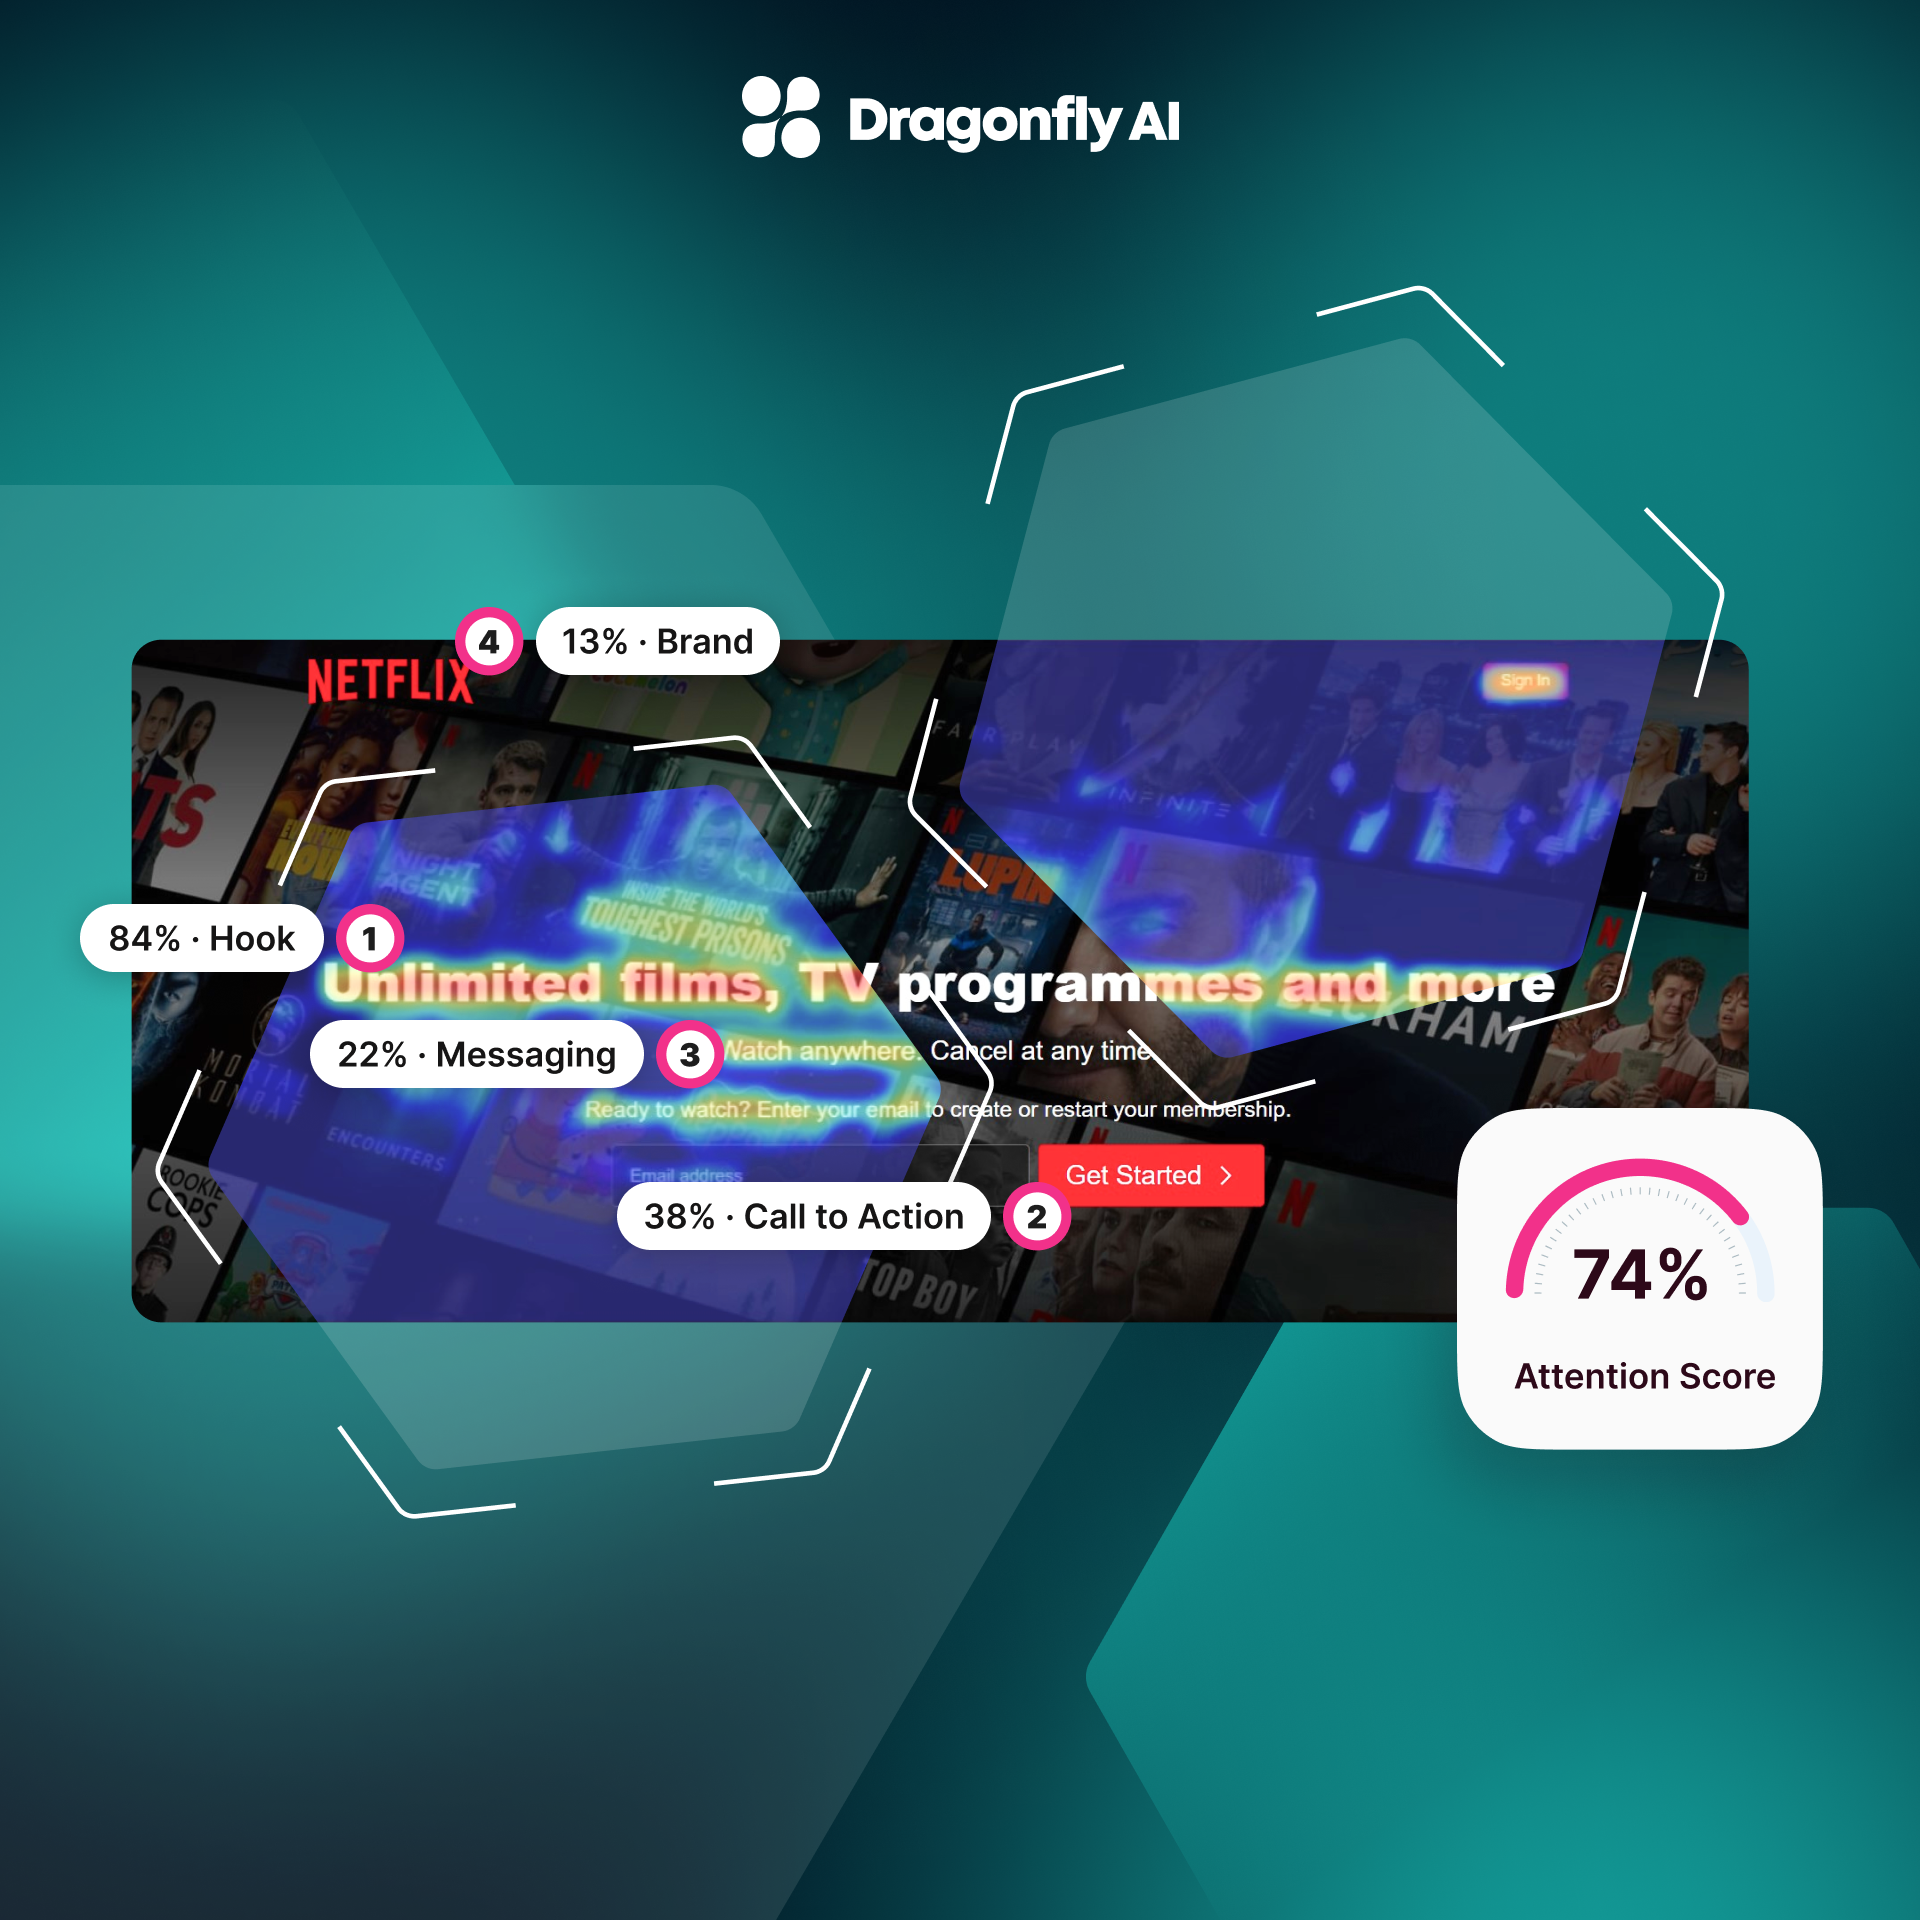
The industry giants Netflix and Amazon are great examples of converting data-driven insights to revenue. Netflix smartly arranges images on landing pages, resulting in increased user engagement. Meanwhile, Amazon's AI-driven recommendations drive 56% of repeat buyers. Leveraging attention heatmaps, Optopus harnessed data-informed insights, making pre-launch experimentation efficient and driving client brands to boost sales by up to 40%. Attention heat maps are a valuable addition to a data-focused strategy as they precisely illustrate where users concentrate their attention.
Maximizing ROI in eCommerce
Attention heatmaps are secret weapons in the eCommerce world. They give you the data you need to make your product pages impactful, checkout processes smoother and cart abandonment rates lower.
Enhance Product Pages
In eCommerce, product pages function as digital storefronts. Businesses build more trust and revenue if their product pages convey their key elements. Attention heatmaps are invaluable tools for product page improvement:
- Identifying Key Features: Heatmaps uncover the most captivating product image elements, such as color or texture, enabling businesses to emphasize these features.
- Optimizing Image Placement: Heatmaps guide strategic image positioning, optimizing visibility and impact.
- Enhancing User Experience: Enhancing image quality and relevance based on heatmap insights enhances the user experience, leading to greater engagement and conversions.
Streamline Checkout Process
Attention heatmaps contribute to e-commerce by optimizing the checkout process with these insights:
- Minimizing Distractions: Heatmaps identify areas where user attention is dispersed or focused on non-essential elements, aiding in distraction removal.
- CTA Placement and Clarity: Effective call-to-action buttons are highlighted, ensuring clarity and strategic placement in the checkout flow.
- Progress Indicators: Users often experience frustration when filling out lengthy forms for purchasing items. Tracking attention on progress indicators helps identify areas where users had less activity and improve it accordingly.
Reduce Cart Abandonment
With a cart abandonment rate of 70.19%, businesses face challenges in e-commerce. Attention heatmaps can assist in addressing cart abandonment issues:
- Optimizing Form Fields: Heatmaps pinpoint form fields where users struggle, aiding in layout and format optimization.
- Security and Trust Building: Insights into user attention on trust elements guide their enhanced visibility and placement.
- Highlighting Conversion Blockers: Identifying obstacles, such as complex navigation, helps create a smoother path to purchase.
- Mobile Optimization: For mobile users who experience high abandonment rates, heatmaps ensure a seamless, user-friendly checkout process.
.png?width=1920&height=1920&name=BlogImage_2%20(1).png)
Boosting ROI in Advertising
Attention heatmap analytics can significantly enhance ad creatives by providing valuable insights such as:
- Enhancing Visual Hierarchy: Heatmaps guide the strategic positioning of ad elements, maximizing visibility and impact by identifying high-attention areas.
- Optimizing Layout and Placement: Advertisers assess CTA button effectiveness with heatmap insights and adjust to boost click-through rates.
- Testing Call-to-Action (CTA) Buttons: Advertisers assess CTA button effectiveness with attention heatmaps, making adjustments to improve click-through rates.
- Identifying Elements to Remove: Heatmaps highlight distracting or ineffective ad elements, facilitating data-driven decisions to create cleaner, more focused ads.
Attention heatmaps also help in A/B testing. A/B testing, which compares two versions of digital assets, is closely tied to heatmap insights for data-driven optimization.
They are interconnected in the following ways:
- Heatmaps as Baseline Data: Heatmaps offer a foundational understanding of user interaction, establishing a pre-A/B test baseline that informs improvement areas and sets the starting point for testing.
- Qualitative analysis: A/B testing yields quantitative metrics, while heatmaps visually represent user attention qualitatively. Combining both metrics provides a wide view of why users are not converging to a particular product.
- Iterative Optimization: A/B testing and heatmap insights form an iterative cycle, guiding continuous refinement through test-driven adjustments based on user interactions.
While A/B testing can be time-consuming as it relies on real user interactions, Contexts by Dragonfly AI streamlines the process, enabling advertisers to predict and optimize attention across a variety of environments, thus speeding up data-driven decision-making.
In addition to Contexts, here are some other valuable tips to enhance your advertising strategy and maximize ROI:
- Visual Hierarchy Optimization: Adjust the visual hierarchy by considering the size, color, and positioning of elements based on attention patterns. Ensure essential components like headlines, images, and calls to action are prominent and captivating.
- Message Alignment: Analyze which parts of your ad copy or messaging receive the most attention. Refine your messaging to align with what resonates most with your audience.
- Reduce Clutter: Remove unnecessary or distracting elements from your ads. Attention data can mitigate it by identifying weak areas of user focus.
- Competitor Analysis: Compare attention data with competitors' ads to identify opportunities for differentiation and optimization.
Unlocking ROI Potential
-
Heat maps are created by displaying the most appealing components of an image to viewers in the form of "hot" and "cold" regions.
-
Heat maps are like an assistant tool that guides on how to optimize content and user experience.
-
Heatmap insights drive ROI by highlighting high-attention areas, optimizing content placement, and improving the user experience.
-
Heatmaps apply to various industries, with examples of their effectiveness in retail, eCommerce, and advertising.
-
Implementing heatmap insights involves tool selection, data analysis, and continuous adaptation.
-
Relying on data-driven choices is a must when dealing with the numerous hurdles in the consumer packaged goods (CPG) sector.
Attention heatmap insights are crucial in converting data into valuable strategies across industries, elevating content, design, and user experiences for heightened ROI.