Heat maps provide a powerful insight into what happens when someone engages with your website or content. As part of an analytics tool, heatmaps can provide you with insight on how your content is performing, allowing you to make data-driven decisions to increase interaction and ROI.
Understand the different types of heatmaps that are out there, and how they can be used within your design production process to optimize the performance of your website.
What are Heatmaps?
Heatmaps are a way of visualizing data. The most common heatmap most people have probably seen is on a weather report. This is used to represent heat and shows red for hot regions and blue for cool.
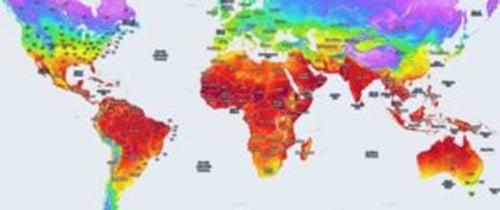
But the focus here is not on the weather but rather on how a heatmap tool can help creative teams get a better understanding of how their content performs by providing visual insights into user behavior and highlighting areas of engagement and interaction.
What are the Differences between Descriptive and Predictive Attention Heatmaps in User Behavior?
The key difference between descriptive and predictive attention heatmaps is the source of data.
Descriptive Heatmaps
Descriptive heatmaps use data that is gathered through actual physical actions whereas predictive heatmaps are based on data that has been predicted through the use of a computer algorithm.
You can split descriptive attention heatmaps into two; Attention heatmaps showing eye-tracking data and attention heatmaps showing mouse-movement data.
Tobii Pro produced descriptive eye-tracking attention heatmaps that are based on eye-tracking experiments where a camera monitors eye movement to see where human attention goes for any piece of content. These experiments tend to be quite expensive and can take a long time to run but the results are high quality and, if you have enough test subjects, the accuracy is high.
Whereas descriptive mouse-tracking heatmaps like the ones produced by Hotjar are based on tracking user traffic on websites. By recording mouse movements and clicks a heatmap can be created to show how users are using websites. Using these products requires your existing websites to have high traffic already to justify making decisions. These tools are well suited if your sole aim is to track user journeys on websites post-launch.
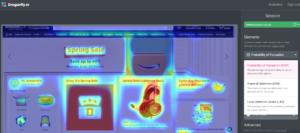
Predictive Heatmaps
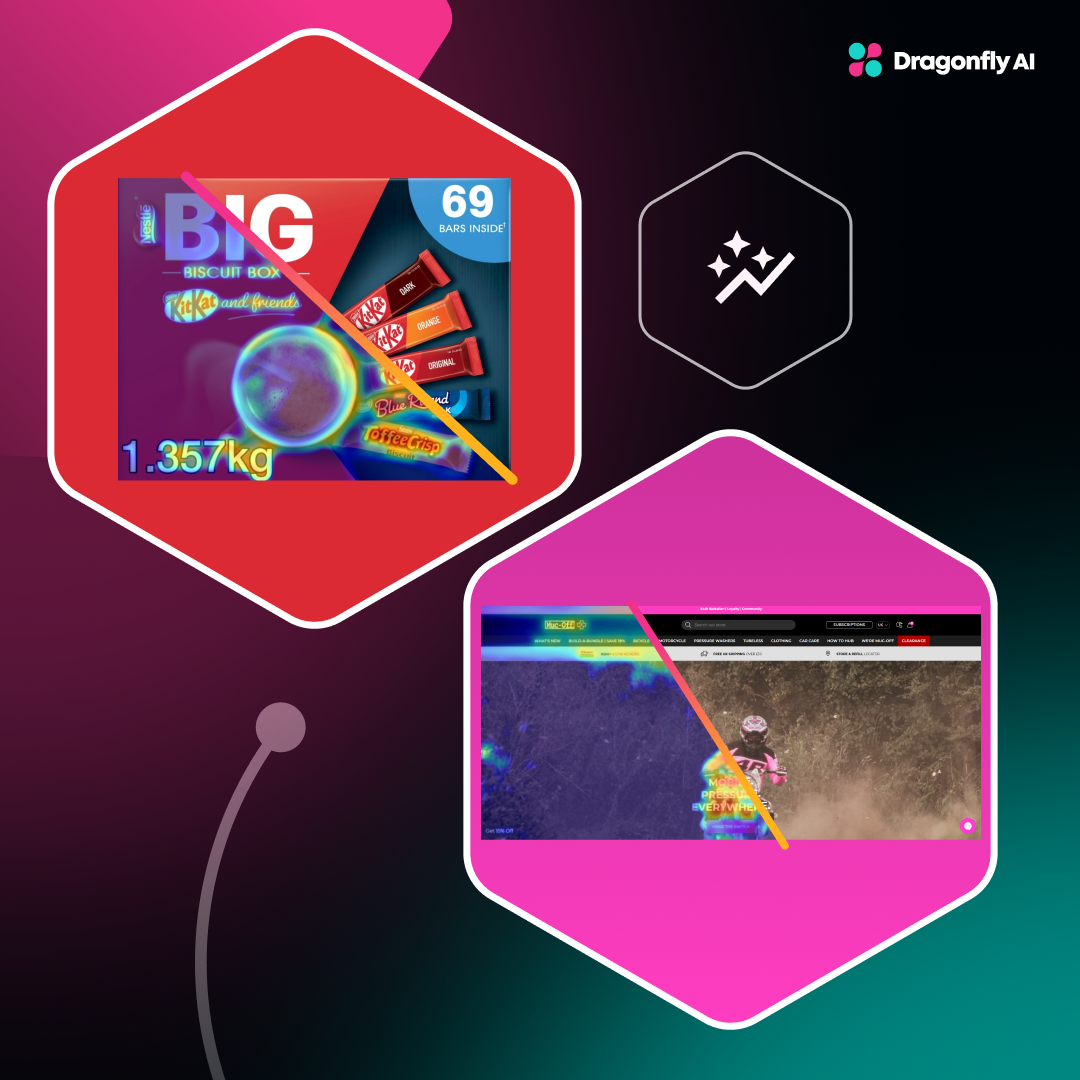
Predictive attention heatmaps utilize artificial intelligence to predict where a typical audience would be likely to look when viewing your content. By integrating predictive heatmaps with a web analytics tool, you can gain comprehensive insights into user behavior and optimize your website effectively.
Dragonfly AI has developed an algorithm that can calculate where human attention goes in any given setting. Therefore you can instantly see whether a call-to-action, product image or even brand logo is attention-grabbing or not. This algorithm isn’t limited to just the digital world though, you can also analyze in-store displays, shelf designs, and even TV ads.
How Heatmaps Work with Web Analytics Tools
Heatmaps can be integrated with web analytics tools to provide a more comprehensive understanding of user behavior. Web analytics tools, such as Google Analytics, can provide data on user interactions, such as page views, bounce rates, and conversion rates. Heatmaps can be used to visualize this data and provide insights into how users interact with specific elements of a webpage or mobile app screen.
For example, a heatmap can be used to identify areas of a webpage where users are clicking the most. By combining this data with Google Analytics, you can track the conversion rates of those clicks and determine which elements are driving the most engagement. This integration allows businesses to optimize their website design and improve user experience by focusing on the elements that matter most to users.
Additionally, tools like Google Tag Manager can be used to set up event tracking, enabling you to capture specific user interactions and visualize them through heatmaps. This combination of heatmaps and web analytics tools provides a powerful way to understand user behavior and make data-driven decisions to enhance your website or mobile app.
Understanding Heatmap Data
Heatmap data can be complex and difficult to interpret, but understanding the basics of heatmap data can help businesses make informed decisions.
Color Palette
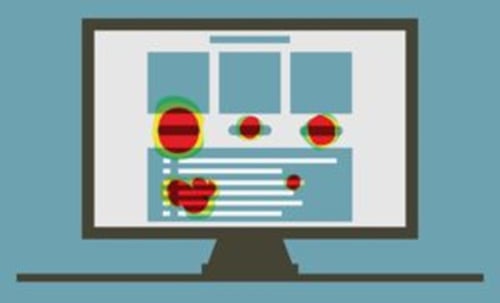
Heatmaps use a color palette to represent different levels of user interaction. The most common color palette used in heatmaps is a gradient of red, orange, and yellow, with red indicating the highest level of interaction and yellow indicating the lowest level of interaction. This visual representation makes it easy to identify areas of high and low engagement at a glance.
Reading a Heatmap
Reading a heatmap requires a basic understanding of the color palette and the data being represented. Here are some tips for reading a heatmap:
-
Identify Areas of High Interaction: Look for areas of the heatmap that are colored red or orange, as these indicate high levels of user interaction. These hotspots are where users are most engaged and can provide insights into which elements are capturing their attention.
-
Identify Areas of Low Interaction: Look for areas of the heatmap that are colored yellow or blue, as these indicate low levels of user interaction. These cold spots may suggest that certain elements are being overlooked or are not as engaging as intended.
-
Look for Patterns: Heatmaps can reveal patterns of user behavior, such as areas of high interaction near calls-to-action or areas of low interaction near navigation menus. Identifying these patterns can help you understand how users navigate your site and where improvements can be made.
-
Use the Data to Inform Decisions: Use the insights gained from the heatmap to inform decisions about website design, user experience, and marketing strategy. For example, if a call-to-action button is not receiving as many clicks as expected, you might consider changing its placement or design to make it more prominent.
By understanding heatmap data and how it works with web analytics tools, businesses can gain a deeper understanding of user behavior and make informed decisions to improve user experience and drive conversions.
Using Heatmaps to Inform Your Decisions
Each of the types of heatmaps mentioned earlier has its own merits, and understanding the key features of different heatmaps can help in making informed decisions throughout your design processes. This next section will show you which heatmap is best suited for the design phase you are in.
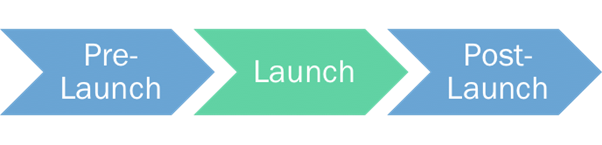
Using Predictive Heatmaps
Predictive heatmaps validate decision-making prior to publishing in the initial design process. Instantly check the impact of in-store displays in drawing customer attention or optimize your UX design for both websites and mobile apps without negatively impacting traffic. Analyze product images against competitors’ on online retail platforms and in context for the most optimized creative.
Using Descriptive Eye-Tracking Heatmaps for Mobile App Screens
Further validate your decisions for important, big-budget projects by using eye-tracking experiments as a mini-performance experiment to see how your content performs once contextual biases are introduced.
Using Descriptive Mouse Movements Heatmaps
Once you have iteratively improved your web design, go live and track actual customer journeys and user experiences using mouse-movement heatmaps to see how the context of content and the users’ own bias makes an impact.
Increase ROI with Heatmap Tool Analysis
Pre-testing at every stage of your creative production journey is critical when it comes to standing out from your competition.
Traditional creative testing takes time and costs money. Having website heat map analysis in your toolbox will undoubtedly give you the upper hand within your design lifecycle. Collecting and analyzing user feedback through surveys and feedback widgets can further enhance the effectiveness of heatmap analysis, enabling you to understand customer behavior and make data-driven decisions to improve user experience.
Interested in finding out more about how our predictive heatmap technology can help you optimize your content? Book a demo with us here.
other topics

Top 5 Benefits of Heatmaps
AI-driven predictive visual analytics is changing the game, empowering brands to optimize their...

What is a Heatmap? How They Work, What They're Used For & Examples
Website heatmaps display website data in graphic form, usually represented by different colors, and...